I just discovered this thread after speaking with Remwines. First off I must say, nice work! I admire your skills and knowledge of electronics and your willingness to share in an open architecture to make it available to peers at no profit. Kudos to you!
I have a 1977 tub with twin 4.236 Perkins without an alarm on the boat! I have 'full instrumentation' at both helms, but it's analog and mechanical. My FB oil press gauges are electric Stewart Warners but my lower helm SW oil press gauges are driven by mechanical, oil-filled capillary tubes. I have electric upgrades in boxes awaiting installation but that's on a back burner. Part of this delay is because I think I should add a monitor with alarms to alert me to problems.
I love the concept of using off-the-shelf components to piece together a system to provide early warning of impending failures. My initial impression is that the price is attractive, but my concerns center on reliability and robust construction for the maritime environment. I understand it's a DIY kit designed for anyone with moderate skills and knowledge, but it would be self-defeating if its hardware components failed rendering the engine inoperative.
Also, being a modular and expandable design, it needs to provide ample capacity for future expansion. With that comes future uses which can make the equipment shift from "nice to have info" to "must have for safety" ... much like our electronic chart plotters have become indispensable. If it's indispensable, it should be near indestructible.
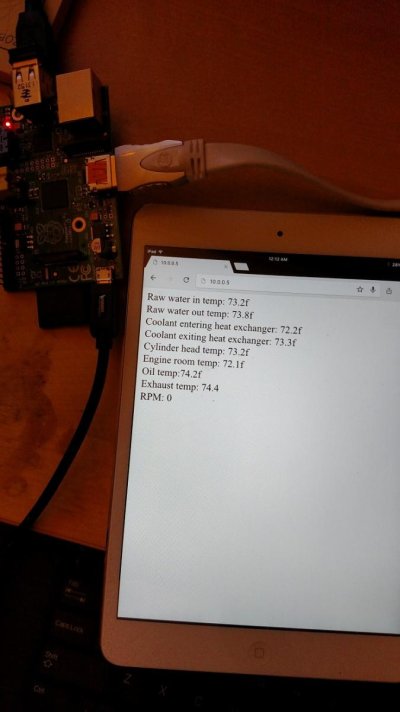
I love djones44's iPad enclosure. I think using an app to present the results via iPad or Android tablet makes the best use of current technology and lower pricing for truly functional displays. Having a screen of numbers scrolling by on a small LED display is less than optimum for processing lots of data. I had to do it on my job for years with old technology. We got by, but the advent of graphic displays made it a cinch to detect the data abnormalities.
Imagine vertical tapes of digital readings with all normal values shown in a straight horizontal line across the display. When all is normal, all the lines segments form a continuous dashed line across the display. Any values out of the norm would jump out at you as a break in the line continuity. All Normal values present in Green, Abnormal Warnings in Yellow and Emergency Shutdown values in Red. In this type of display, the value of the data point is not as important as its variance from the norm.
So if I can build an affordable, robust box that will stand up to the rigors of ER life that provides me with essential engine and environment data and displays it graphically via wifi to my devices, I'm aboard. Otherwise, I might as well just have dumb analog horns that sound when a value is exceeded. At least they're cheap and reliable.
")