I mentioned in my intro that, years ago, I worked on board a hydrographic research ship for NOAA, and @rsn48 asked if I could do a post about chart inaccuracies. So, with the caveat that I’ve been out of the hydrographic surveying game for a couple decades, here goes:
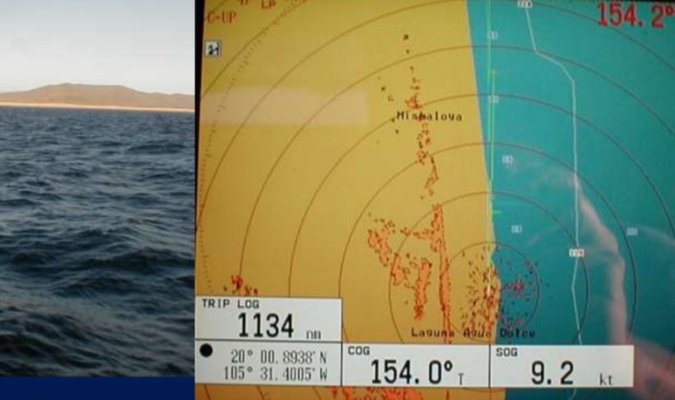
Like folks are probably aware, most charts (especially smaller scale charts) are made up of data collected by multiple sources over many years. And all but the most recent charting data suffers from three critical issues: position accuracy, depth accuracy, and coverage. I don’t know what the most current stats are, but it’s safe to say that well over half of the data on today’s charts was collected with old (sometimes very old) technology that suffers from all three of these factors to varying degrees.
When I was a young survey tech, I always looked forward to the early planning phases of our projects, looking at how the survey areas were laid out in the working grounds, daydreaming about what this reef or that salt chuck would be like to explore. And one of the coolest parts of that exercise was setting up the comparisons with past surveys.
As part of our chart package, HQ would send us copies of every survey that had ever been done in the regions we were responsible for mapping. And I mean _every_ survey. Oftentimes, these would include copies of 19th century surveys, US navy tracklines, etc. Part of our job was to verify shoal soundings or obstructions identified by these surveys, so we’d try to position them to the best of our ability, and then see if we could prove, disprove, or improve on the findings from these prior surveys.
Much of the data collected from these early surveys was done the “old way”: with leadlines and sextants. I’m guessing people here are pretty familiar with how this works: a guy in the boat casts the leadline and, when the boat gets up even with the line (it’s perpendicular), he’d call out the depth while other members of the team took a three-point sextant fix (often based on towers over known points on land).
It’s an ancient technique and can collect pretty accurate sounding data, but it suffers from obvious issues with coverage: the chance of dropping the lead on the shoalest spot on the bottom is pretty slim. And such sparse coverage makes the actual topography of the bottom a mystery. Accuracy can also be suspect, depending on the positioning of towers or reference marks on land. Even if you did nail a shoal sounding, challenges in correcting the data - accounting for tides, geoid references for known positions, etc. - could erode position and/or depth accuracy.
(Aside: it wasn’t that unusual for us to use leadlines to measure definitive depths on certain features back when I was surveying. One thing that was great about working in hydrography when I did was that we were at a transition point between legacy and modern technologies. We got to learn both.)
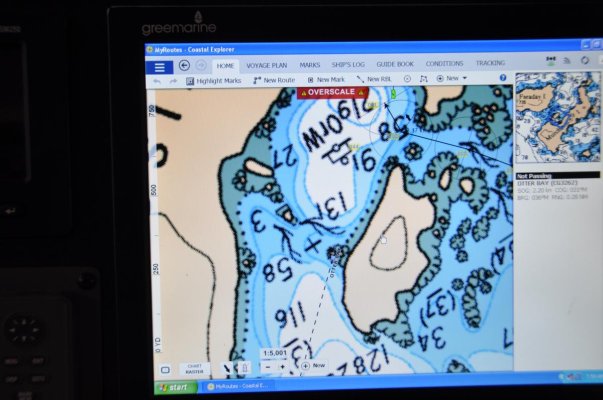
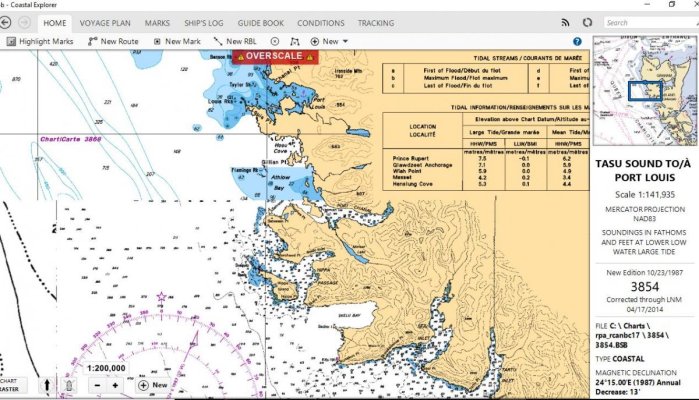
Even if you managed to bypass many of these issues around data collection itself, errors can still be introduced in the process of plotting, drafting, and printing. Going from a very large-scale chart created during surveying to the much smaller-scale versions typically used for navigation, tiny errors in position get magnified dramatically during the printing process. (Remember, a huge portion of chart data - bottom topography, shoreline, rocks and other obstructions - is drawn onto charts by hand. If the little asterisk representing that rock is off a teeny bit on a 1:1,000 scale chart, what does that look like at 1:10K or 1:50K?)
Anyway, hopefully that gives folks a flavor for some of the challenges associated with producing accurate nautical charts. The technology has evolved rapidly and with multibeam echosounders, true vector digital charts, etc., things will keep getting better. But our coastlines are vast and so many of the places of interest to recreational boaters are low on the priority list when the folks at NOAA look at the backlog of charts to be updated. It’s great to see ZOC (zone of confidence) info making its way onto more and more charts. Hopefully that plus true vector charts will go a long way toward making things safer and providing sailors with an appropriate level of confidence in their charts.
Curious to hear stories from people on places where charts were wildly off, strategies for dealing with areas where data is sparse or absent altogether, etc. And, of course, happy to share other stories of hydrographic hijinks from my time in AK and elsewhere (yes, I've been chased by bears, have been stranded in big seas in a skiff, have inadvertently tested how well Mustang suits and coats work when fully submerged, etc. :lol") !
!
Like folks are probably aware, most charts (especially smaller scale charts) are made up of data collected by multiple sources over many years. And all but the most recent charting data suffers from three critical issues: position accuracy, depth accuracy, and coverage. I don’t know what the most current stats are, but it’s safe to say that well over half of the data on today’s charts was collected with old (sometimes very old) technology that suffers from all three of these factors to varying degrees.
When I was a young survey tech, I always looked forward to the early planning phases of our projects, looking at how the survey areas were laid out in the working grounds, daydreaming about what this reef or that salt chuck would be like to explore. And one of the coolest parts of that exercise was setting up the comparisons with past surveys.
As part of our chart package, HQ would send us copies of every survey that had ever been done in the regions we were responsible for mapping. And I mean _every_ survey. Oftentimes, these would include copies of 19th century surveys, US navy tracklines, etc. Part of our job was to verify shoal soundings or obstructions identified by these surveys, so we’d try to position them to the best of our ability, and then see if we could prove, disprove, or improve on the findings from these prior surveys.
Much of the data collected from these early surveys was done the “old way”: with leadlines and sextants. I’m guessing people here are pretty familiar with how this works: a guy in the boat casts the leadline and, when the boat gets up even with the line (it’s perpendicular), he’d call out the depth while other members of the team took a three-point sextant fix (often based on towers over known points on land).
It’s an ancient technique and can collect pretty accurate sounding data, but it suffers from obvious issues with coverage: the chance of dropping the lead on the shoalest spot on the bottom is pretty slim. And such sparse coverage makes the actual topography of the bottom a mystery. Accuracy can also be suspect, depending on the positioning of towers or reference marks on land. Even if you did nail a shoal sounding, challenges in correcting the data - accounting for tides, geoid references for known positions, etc. - could erode position and/or depth accuracy.
(Aside: it wasn’t that unusual for us to use leadlines to measure definitive depths on certain features back when I was surveying. One thing that was great about working in hydrography when I did was that we were at a transition point between legacy and modern technologies. We got to learn both.)
Even if you managed to bypass many of these issues around data collection itself, errors can still be introduced in the process of plotting, drafting, and printing. Going from a very large-scale chart created during surveying to the much smaller-scale versions typically used for navigation, tiny errors in position get magnified dramatically during the printing process. (Remember, a huge portion of chart data - bottom topography, shoreline, rocks and other obstructions - is drawn onto charts by hand. If the little asterisk representing that rock is off a teeny bit on a 1:1,000 scale chart, what does that look like at 1:10K or 1:50K?)
Anyway, hopefully that gives folks a flavor for some of the challenges associated with producing accurate nautical charts. The technology has evolved rapidly and with multibeam echosounders, true vector digital charts, etc., things will keep getting better. But our coastlines are vast and so many of the places of interest to recreational boaters are low on the priority list when the folks at NOAA look at the backlog of charts to be updated. It’s great to see ZOC (zone of confidence) info making its way onto more and more charts. Hopefully that plus true vector charts will go a long way toward making things safer and providing sailors with an appropriate level of confidence in their charts.
Curious to hear stories from people on places where charts were wildly off, strategies for dealing with areas where data is sparse or absent altogether, etc. And, of course, happy to share other stories of hydrographic hijinks from my time in AK and elsewhere (yes, I've been chased by bears, have been stranded in big seas in a skiff, have inadvertently tested how well Mustang suits and coats work when fully submerged, etc. :lol
!