Well, everyone has their own preferences and what they are comfortable with. To me, the advantages and flexibility of vector charts are so glaringly obvious that to be honest I didn't think anyone even supplied raster charts these days until this thread. Nobody I know personally who uses a plotter on their boat has raster chart displays. I have for years now assumed they had gone the way of eight track cassettes.
")
In narrow passes, unfamiliar harbor approaches, etc., the vector plotters give us outstanding clarity of detail no matter how zoomed in or out we are, while the depth sounder and radar continue to be the same valuable tools they've always been. For us, navigation is a matter of using all the systems available to us just as it is in a plane, rather than focusing on just one system. So when we are in fog, for example, we are actively using both plotters (with different displays on each one), the compass, the radar, the depth/speed display, the intercom, the horn, our eyes and our ears. But not the bell.
When we are navigating in good visibility, nothing changes other than we don't have the intercom on, we aren't using the horn, and we don't give the radar as much attention as we do when the visibility is poor or nonexistant.
Below is an example of what I'm talking about with regard to what I believe is the superiority of vector displays. These screen shots were just taken off my iPad 2 using a charting application called Navimatics. This is not a plotter app but a chart app. While not nearly as detailed as the displays on the big plotters on the boats, and the iPod 2 is not as sharp as the displays on the plotters, they are still vector charts and so will serve as illustrations. I have no idea who creates the vector charts for Navimatics.
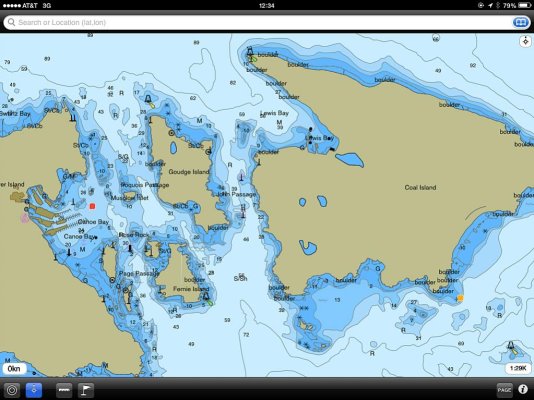
The charts show a narrow, dogleg passage between a pair of islands in lower BC near Sidney. This passage averages 170 yards wide and has shallow, rocky ledges all over the place, lots of kelp, etc. It also gets very strong tidal currents running through it. The upside is that it shortens the time it takes to get from the one side of the islands to the other; the alternative is to run around them. But it's critical to follow the right path through the pass, and this can be made fairly challenging when the current is running. We've been through it several times and it's always an interesting experience.
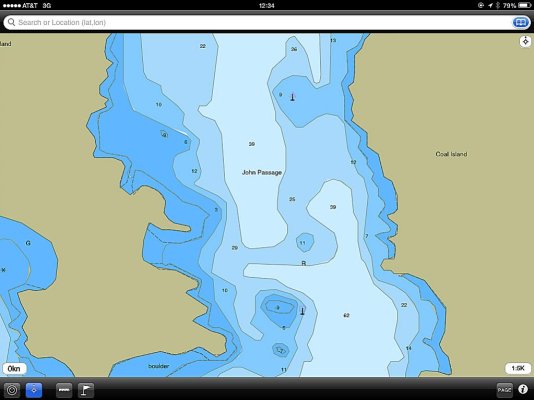
The first screen shot shows an overview of the passage. The second shot is zoomed in as far as Navimatics will go on where the dogleg course changes have to be made. The chart plotters on the boats will go in much tighter than this if one wants to, with no loss of detail or clarity.
I cannot imagine driving a boat through this kind of terrain with anything less than the clarity and flexibility of a vector plotter. And as described earlier, on our newer plotters any lighted navaids will portray the actual light color and flash pattern if that's of value, and in this particular passage, the direction and speed of the current through here is displayed in real time.
Again, these are iPad screen shots from a charting app. They are not shots of the display on one of our plotters.

 x2
x2